July 21st, 2026
Part 2 of 3: Interpreting The Data
Written by

Carmen Olmetti
In collaboration with

Two compensation plans can look almost identical on paper and still produce very different outcomes for the people working under them. A benchmark that reports pay mix and OTE tells you how a plan is built, but not whether it works. Interpreting that data, understanding why a given role and segment carry the structure they do, is what seperates a number you can quote from a decision you can defend.
This is the second of three guides we developed with RepVue. The first covered how to read compensation data. This one covers how to interpret it:
Why pay mix shifts across roles
Why OTE rises as you move up-market
How performance measures should track the work
Why quota attainment ultimately determines whether two similar-looking plans are comparable
How the competency model underneath a career architecture explains why one level is paid more than another
Compensation is not designed in isolation. It is the final step in a chain that begins with how a company segments its market and flows through the roles that serve each segment. Customer segmentation determines the type of selling required; career architecture translates that into role levels; and role design specifies what each level actually does.
Compensation is The Last Step in a Chain
Each stage sets up the next. Pay is designed last, not in isolation.
Determines the type of selling each part of the market requires.
Translates segments into role levels and a leveling framework.
Specifies what each level actually does day to day.
Rewards the behavior that drives success in each role.
Skip a stage and pay ends up rewarding outcomes the role was never built to control.
Compensation then rewards the behavior that drives success in each role. When organizations skip that chain and copy a pay structure from one role to another, they end up paying for outcomes the role does not control. Different roles across the sales process and across segments require different OTE, pay mix, accelerator structures, and performance measures, and career architecture is what makes that differentiation systematic rather than improvised.
Pay mix, the split between guaranteed base and at-risk variable, should reflect how much control a role has over its own results and how quickly those results become visible. The more directly and quickly a role influences a deal, the more pay can sit in variable, because the seller can move the number. The longer and less predictable the cycle, the more the role needs in base, because tying a large share of income to a deal that takes months to close and depends on a buying committee creates instability rather than motivation.
Pay Mix Tracks Control Over The Outcome


The pattern across the go-to-market organization is consistent. SDRs and BDRs typically run a 70/30 base-to-variable mix because they have high activity metrics and short cycles. SMB AEs earn 50/50 or 60/40 because they have high influence over the deal and quick feedback loops. Enterprise AEs earn 60/40 or 70/30 because long sales cycles require income stability. Customer Success roles typically earn 80/20 or 70/30, given their focus on retention rather than transactional closing.
The same ratio can appear in two roles for opposite reasons. An SDR and an Enterprise AE may both sit near a 70/30 split. The SDR carries more variable because the work is high-volume and largely within the rep's control. The Enterprise AE carries more base because the work is long, complex, and subject to forces outside the rep's hands. The number alone does not explain the plan; the reasoning behind it does.
OTE increases from SMB to Enterprise, driven by the value and complexity of the work rather than seniority alone. An Enterprise AE commands higher OTE than an SMB AE because the deals are larger, the cycles longer, the buying committees more complex, and the strategic stakes higher. The pay reflects the scope of the role, and career architecture creates the framework that makes the defensibility of the difference clear rather than arbitrary.
The market data clearly show the gradient. As of mid-2026, RepVue's verified seller data puts the US median OTE for an SMB Account Executive near $135,000, with median base around $70,000. The general Account Executive median OTE sits near $200,000. The Enterprise Account Executive median OTE sits near $275,000, with a median base around $140,000. Both OTE and base rise with the segment because the work itself carries more value.
OTE Rises With the Scope of the Work


This is also why segmentation must precede compensation design. Without clearly defined SMB, Mid-Market, and Enterprise segments, the roles that serve them cannot be benchmarked accurately, and the result is an SMB pay structure applied to Enterprise work, or the reverse. The same misalignment shows up in cost of sales: deploy senior, expensive talent against small deals, and you overspend; assign junior reps to complex enterprise opportunities, and you lose revenue you should have won.
Pay mix and OTE are the most visible numbers, but segmentation flows through to the entire structure of a plan, including quota size, accelerator design, and base salary level.
SMB compensation leans toward a balanced base-to-variable mix to drive activity. Quotas are smaller, individual performance varies more, and accelerators begin at lower absolute dollar levels while still delivering meaningful upside. Base salaries are lower, reflecting the entry-level talent the segment typically deploys.
Mid-Market compensation balances stability and incentive. Pay mix moves toward 60/40 or 50/50. Quotas are larger and call for more sophisticated selling, and accelerators reward both deal quality and quantity.
Enterprise compensation emphasizes stability and relationship building. Pay mix often reaches 70/30 base-to-variable. Quotas are substantial, but account for longer cycles, and accelerators may include strategic account bonuses and multi-year deal incentives. Base salaries are significantly higher, reflecting the senior talent the segment requires.
Read across the three, and compensation tracks the sales motion. Fast, transactional, high-volume work pushes pay toward variable and keeps base modest. Slow, complex, relationship-driven work pushes pay toward base and concentrates the upside in strategic accelerators.
Interpretation extends beyond the dollar figures to what those dollars reward. A hunter should be measured primarily on new logo acquisition. A farmer should be measured on expansion and retention. A role with split responsibility needs blended measures that reflect its actual time allocation. When a compensation structure is copied from one role to another without adjusting the measures, the plan ends up paying for behavior the role does not perform. The way a role is deployed day-to-day and the way it is paid have to align, and that alignment breaks the moment the measures are inherited rather than designed for the work in front of the rep.
Pay mix, OTE, and quota are inputs. Quota attainment is the output that reveals whether the design actually works, and it is the single most important figure for comparing two plans. Consider two Enterprise AE plans that look nearly identical on paper:
Two Plans, Same Shape, Different Reality
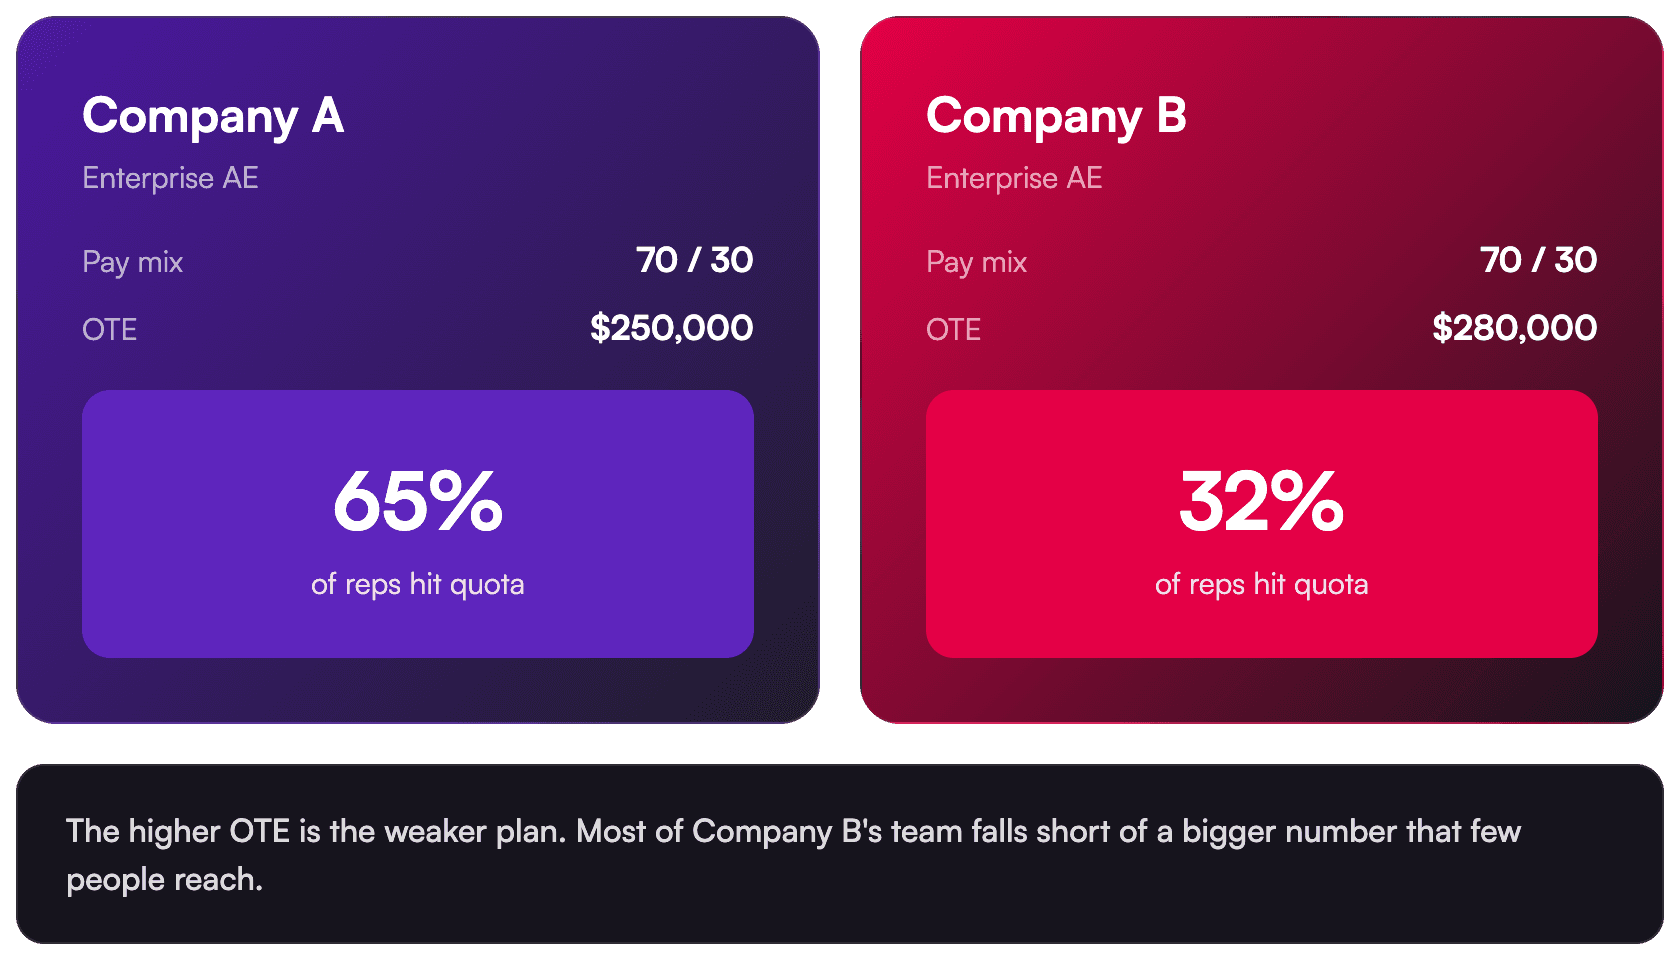

Company A pays a $250,000 OTE on a 70/30 mix, with 65 percent of the team reaching quota. Company B pays a $280,000 OTE on the same mix, but only 32 percent of its team reaches quota. On the surface, Company B looks like the stronger offer. Factored against attainment, the two are not close. At Company A, most reps earn at or near their target. At Company B, most fall short of a larger number that few people reach. The plan that pays less on paper pays more in practice.
Attainment closes the loop between what a plan intends and what it delivers, and it is one of the few data points that comes directly from sellers rather than from managers or finance. RepVue tracks it by company and role for exactly this reason. The broader market reinforces the point: overall cloud sales attainment is near 44 percent, cybersecurity is lower at around 38 percent, and data and AI roles are closer to 50 percent. Against that backdrop, any single OTE figure means little until you know what share of the team reaches it. A high OTE paired with low attainment is not a generous plan; it is an optimistic one.
One further dimension is worth interpreting: the spread between the median earner and the top performer. That spread widens sharply as you move up-market, and it is created almost entirely by accelerators rather than by base salary differences. RepVue's data shows top-performing Enterprise AEs earning well over $600,000 in total compensation against a median near $275,000, more than double. A well-designed accelerator structure is what separates a plan that retains top talent from one that effectively caps earning potential at 100 percent of quota.
A sound interpretation reads three points rather than one: the median, which shows what a typical rep earns; the attainment rate, which shows whether the median is realistic; and the top-performer figure, which shows whether the plan rewards excellence or flattens it. Together they describe what kind of plan you are actually looking at.
Interpreting compensation by role and segment answers part of the question, but it leaves another open: within a single role, why is an IC4 paid more than an IC2? The answer is not tenure. It is the depth of capability the level requires, and that is what a competency model defines. The competency model is the foundation that connects talent strategy to career architecture and allows an organization to justify pay differences between levels with something more durable than years of service.
What a Competency Model Defines at Each Level
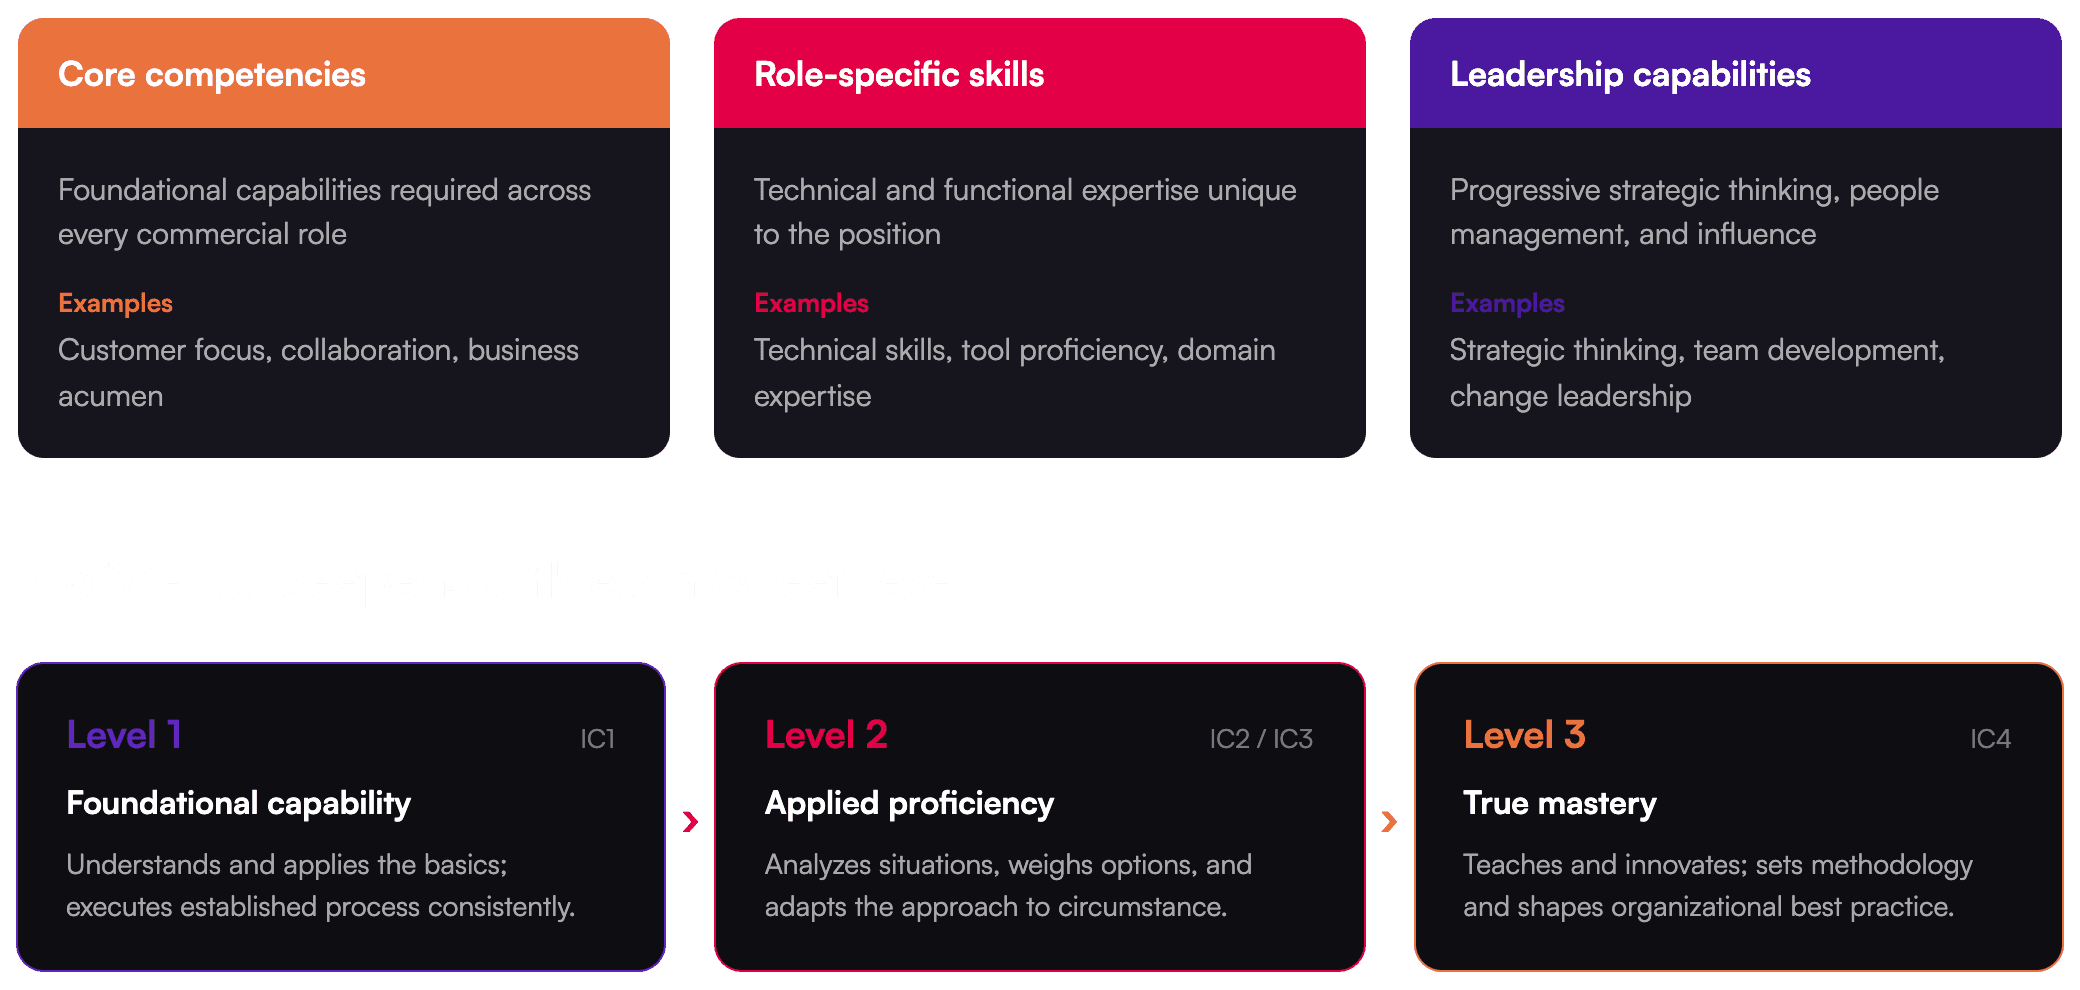

A well-designed competency model defines three categories of capability. Core competencies are the foundational capabilities required across every commercial role, such as customer focus, collaboration, and business acumen. Role-specific skills are the technical and functional expertise unique to the position, including technical skills, tool proficiency, and domain expertise. Leadership capabilities cover the progressive development of strategic thinking, people management, and influence. Most organizations define a working set of around a dozen sales competencies across these categories, from account planning and buyer engagement to negotiation, value realization, and systems proficiency, tailored to their own sales process and segments.
Each competency is then defined at three proficiency levels that map to career progression. At Level 1, foundational capability, a rep demonstrates understanding and basic application, executing established process consistently, which is what you expect at IC1. At Level 2, applied proficiency, a rep analyzes situations, evaluates options, and adapts their approach to circumstance, which is typical of IC2 and IC3. At Level 3, true mastery, a rep not only executes at a high level but teaches others, innovates on methodology, and shapes organizational best practice, which is the mark of an IC4. The difference in pay between levels is, in effect, the market price of that difference in capability, and benchmarking is how you confirm you are paying it accurately.
This is why competency models and compensation are two sides of the same system. The competency model defines what good looks like at each level; benchmarking establishes what that level of capability earns in the market; and the resulting pay bands reward genuine progression rather than time served. When the two are integrated, organizations see measurable gains in hiring precision, performance clarity, development focus, and retention, because reps can see exactly what advancement requires and what it pays.
Once you can interpret why a plan is shaped the way it is, read attainment as the measure of whether it works, and connect pay differences to the competency depth each level requires, the remaining question is practical: how do you turn this understanding into defensible pay ranges and a career architecture that reps can see and managers can use? That is the subject of the third and final guide in this series.

RevEng Consulting is a B2B go-to-market and revenue consulting firm with offices in Chicago, Houston, and Los Angeles, designing the revenue architecture that turns demand into pipeline.

RepVue provides crowdsourced compensation and quota attainment data from verified B2B software sellers. Explore data by role, company, and level at repvue.com.
Related
How to Read Sales Compensation Benchmark Data is the first post in this series.
What Does Market Competitive Mean? explores positioning against the market in depth.
The Sales Compensation Growth Model on revengconsulting.com connects segmentation, roles, and compensation.