

The price that generates the most revenue is not the one that yields the highest profit. This article explains how elasticity modeling finds the profit-maximizing price, segment by segment, using data you already have.
Price elasticity measures how demand responds to a change in price. Model it well, and pricing shifts from a judgment call to a calculation: for any price, you can estimate the volume, the revenue, and the resulting profit. That is the difference between guessing at a price and solving for one.
This article is part of our Pricing and Packaging series and goes deeper into the analytics behind the first ninety days. It builds on our primer on price elasticity. Throughout the series, we follow Meridian Software, an eighty-million-dollar workflow platform; here we model one of its segments.
Elasticity is the percentage change in demand for a one percent change in price. When a one percent price rise costs you less than one percent of volume, demand is inelastic, and you have room to raise the price. When it costs you more than one percent, demand is elastic, and the increase works against you.
Most B2B products are more inelastic than their sellers assume, especially for the segments that depend on them. A customer who runs core operations on your product, as we discussed in the Customer decision, has few substitutes and high switching costs, which defines inelastic demand.
Here is the insight that changes how companies price: the price that maximizes revenue and the price that maximizes profit are different prices, and the profit-maximizing price is higher. Revenue peaks where elasticity equals one. Profit peaks past that point, because once cost to serve is subtracted, the best price sits higher up the curve.
The Profit Sits Above The Revenue Peak
Optimizing for revenue leaves profit on the table. The two best prices are not the same price.


The gap between the two peaks is not arbitrary. On a linear demand curve, the cost to serve is exactly half the revenue, so a product costing $500 a month to serve has a profit peak $250 above its revenue peak. The higher the cost to serve, the further apart the two prices sit, and the more a company loses by optimizing for the wrong one.
Companies that optimize for revenue or volume systematically underprice because they are aiming at the wrong peak. The profit-maximizing price is the one to solve for, and for a product with known elasticity and marginal cost, it can be computed directly: the optimal price equals marginal cost divided by one plus the inverse of elasticity. At an elasticity of -2 and a marginal cost of 5, the profit-maximizing price is 10.
The model starts with a demand curve, which estimates how much you would sell at each price. You can build one from data you already have, so this is not the multi-quarter research project it is often assumed to be.
Past deals, win-loss records, and how quotes converted at different price points reveal the real relationship between price and demand for your product.
Where history is thin, methods like Van Westendorp and Gabor-Granger, covered in the research methods article, estimate the curve from buyer responses.
A straightforward linear demand curve, where a price change produces a proportional change in volume, works well when data is limited, and it usually falls within a few percent of a more complex model. Sophistication that outruns the data adds false confidence, not accuracy.
A single company-wide elasticity hides more than it reveals, because different segments respond very differently to price. The segment that depends on your product is inelastic and can bear a higher price; the segment with easy alternatives is elastic and cannot.
Modeling elasticity per segment is what lets you set a different profit-maximizing price for each, which is the analytical core of value-based pricing. It connects directly to the segments from the first decision and the margin floors from the fifth.
One blended elasticity produces one mediocre price. The value of the model is in the segments: pricing the inelastic segment higher and the elastic one more carefully is where the profit actually lives. A blended number is also the more dangerous output, because it looks like analysis. A company that has modeled one elasticity for the whole base believes it is pricing on evidence while still charging every segment the same.
Consider a segment currently paying $2,000 per month, with about 1,000 customers and a cost to serve of $500 per customer. With an estimated elasticity, we can model what happens across a range of prices and read the profit-maximizing point directly.


The model shows the two peaks. Revenue is highest around $2,400, and profit peaks in the same region and stays strong slightly above it, well over the current $2,000. At today’s price, the segment is underpriced against its own elasticity, and moving toward the profit peak lifts monthly profit meaningfully without the volume collapse the team may have feared. The numbers here are illustrative, but the shape is what matters: the current price sits to the left of the peak, which is the most common finding of all.

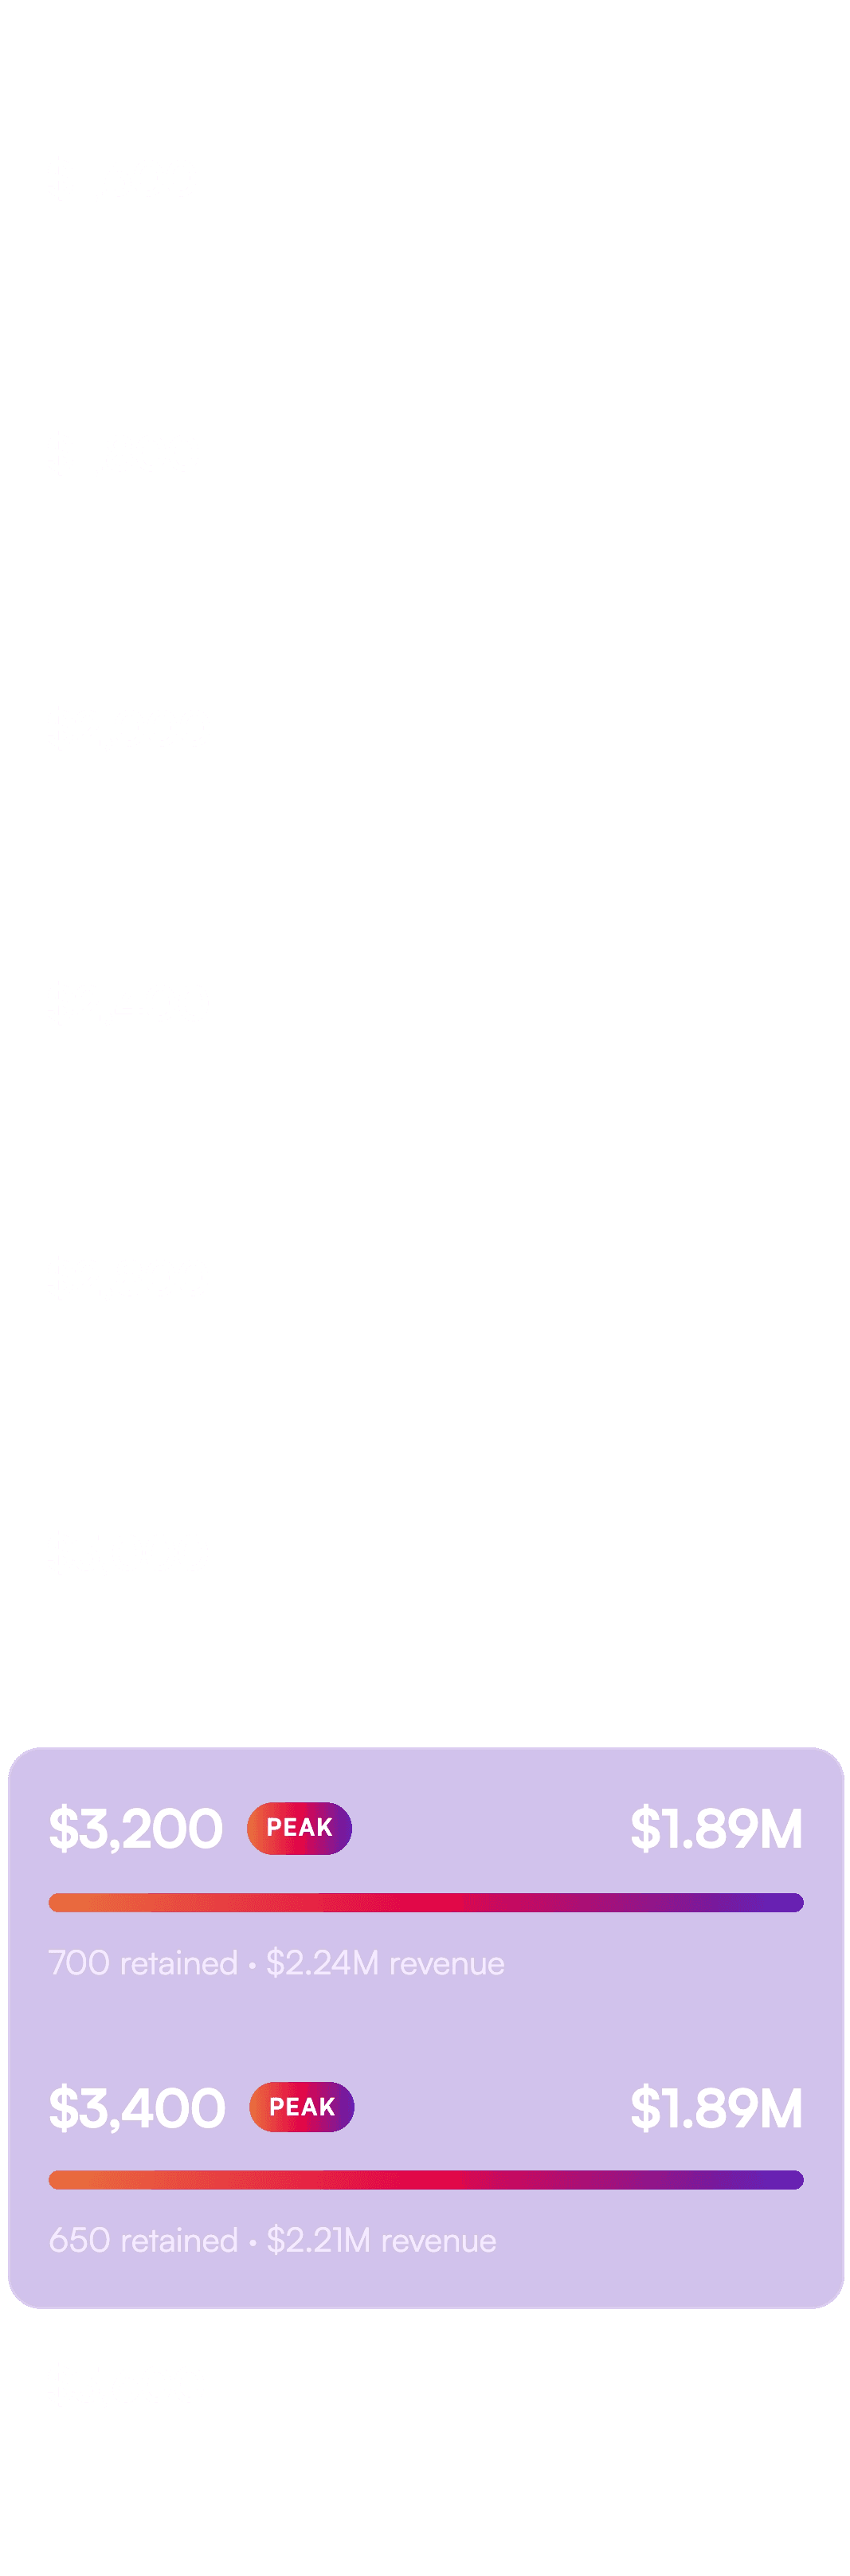
The two peaks are visible, and they are not the same price. Revenue is highest at $3,000. Profit climbs to $3,200, then holds flat at $3,400 before turning down. A company optimizing for revenue stops at $3,000 and leaves about $10,000 a month on the table.
The rows below the current price are the more uncomfortable half of the table. Every discountino that range costs in volume it never recovers: dropping from $2,000 to $1,600 wins a hundred more customers and gives up $290,000 a month in profit. Against the peak at $3,200, that same discounted price is running $680,000 a month behind.
The numbers are illustrative, but the shape is the finding, and it is the most common one in this work: the current price sits well to the left of both peaks, and any discounting from there moves in the wrong direction twice over.
Meridian Software’s mission-critical segment—the one that runs daily operations for the product—is the natural place to model. These customers have high switching costs and few substitutes, so the segment is inelastic, and Meridian has been pricing it at about $2,000 per month by default rather than based on analysis.
Building a demand curve for the segment from Meridian’s own win-loss and renewal data would almost certainly show the profit peak well above $2,000, in the $3,000 to $4,000 range the earlier decisions pointed to. The model turns that estimate from a judgment into a defensible number, with the volume-at-price scenarios to support the change.
That defensibility is the practical output. The segmentation work said the segment could support more. The elasticity model shows how much more, and the volume you would expect to lose getting there, which is the question a CFO asks first and one a segmentation study cannot answer.
AI has made elasticity modeling far more accessible. Machine-learning models estimate demand curves from transaction data, update continuously as the market moves, and capture non-linear effects that simple models miss, which previously required a specialist team and a long engagement.
That puts profit-maximizing pricing within reach of companies that could not previously afford the analytics, though the same caution applies: a model is only as good as the data and the judgment behind it. We cover the two-sided shift in our article on pricing power in the age of AI.
Elasticity modeling is the analytical engine beneath several of the six decisions. It sharpens Value by quantifying how much price a segment will bear; it informs Price and Economics decisions; and it draws on our primer on inelastic price elasticity.
This work sits inside our broader commercial transformation practice, where pricing analytics connect to the data and systems the whole revenue engine runs on.
The profit-maximizing price is a number you can solve for, not a judgment you have to guess at. Build a demand curve from your own data, model it by segment, and aim for the profit peak rather than the revenue peak, which almost always sits higher than the current price.
For Meridian, modeling its inelastic segment turns a directional opportunity into a defensible price. For any company, elasticity modeling is how instinct about pricing power becomes evidence.
Download the Pricing and Packaging Framework
The complete framework, with the maturity ladder, the diagnostic, and a sequenced ninety-day plan.
The Pricing and Packaging Assessment
We build the elasticity model with you using your own deal data and identify the profit peak by segment.
Next, the final article: the research methods that measure willingness to pay directly, from conjoint and MaxDiff to Van Westendorp and Gabor-Granger, the survey techniques that feed the models in this article.
Sources
The profit-maximizing price formula and the revenue-versus-profit-peak relationship are standard results in pricing economics. Scenario figures are illustrative. Directional claims about B2B inelasticity draw on published pricing research.