

On-Target Earnings, or OTE, is the total a seller earns at exactly 100 percent of quota: base salary plus target incentive. Getting the number right determines whether you can hire the talent the role requires and whether the plan you build around it is affordable.
A compensation analyst opens a benchmark file for a Mid-Market Account Executive based in Chicago and finds a national median OTE of $175,000. The company wants to pay above market. The question this post answers is how that figure becomes the number on the plan document.
This is a deeper look at Element 2 of Layer 4 in the Sales Compensation Growth Model, Pay Architecture and On-Target Earnings. It builds on the career architecture that defines the levels an OTE is attached to, and it feeds into every element that follows, including pay mix, pay curves, and accelerators.
OTE has two components. Base salary is fixed annual pay, guaranteed regardless of performance. Target incentive is the variable a seller earns at exactly 100 percent of quota.
The ratio between them is the pay mix, written as a split such as 60/40. In a 60/40 plan, 60 percent of OTE is guaranteed, and 40 percent is at risk based on quota performance.
The anatomy of an OTE
On-Target Earnings is what a seller earns at exactly 100 percent of quota.

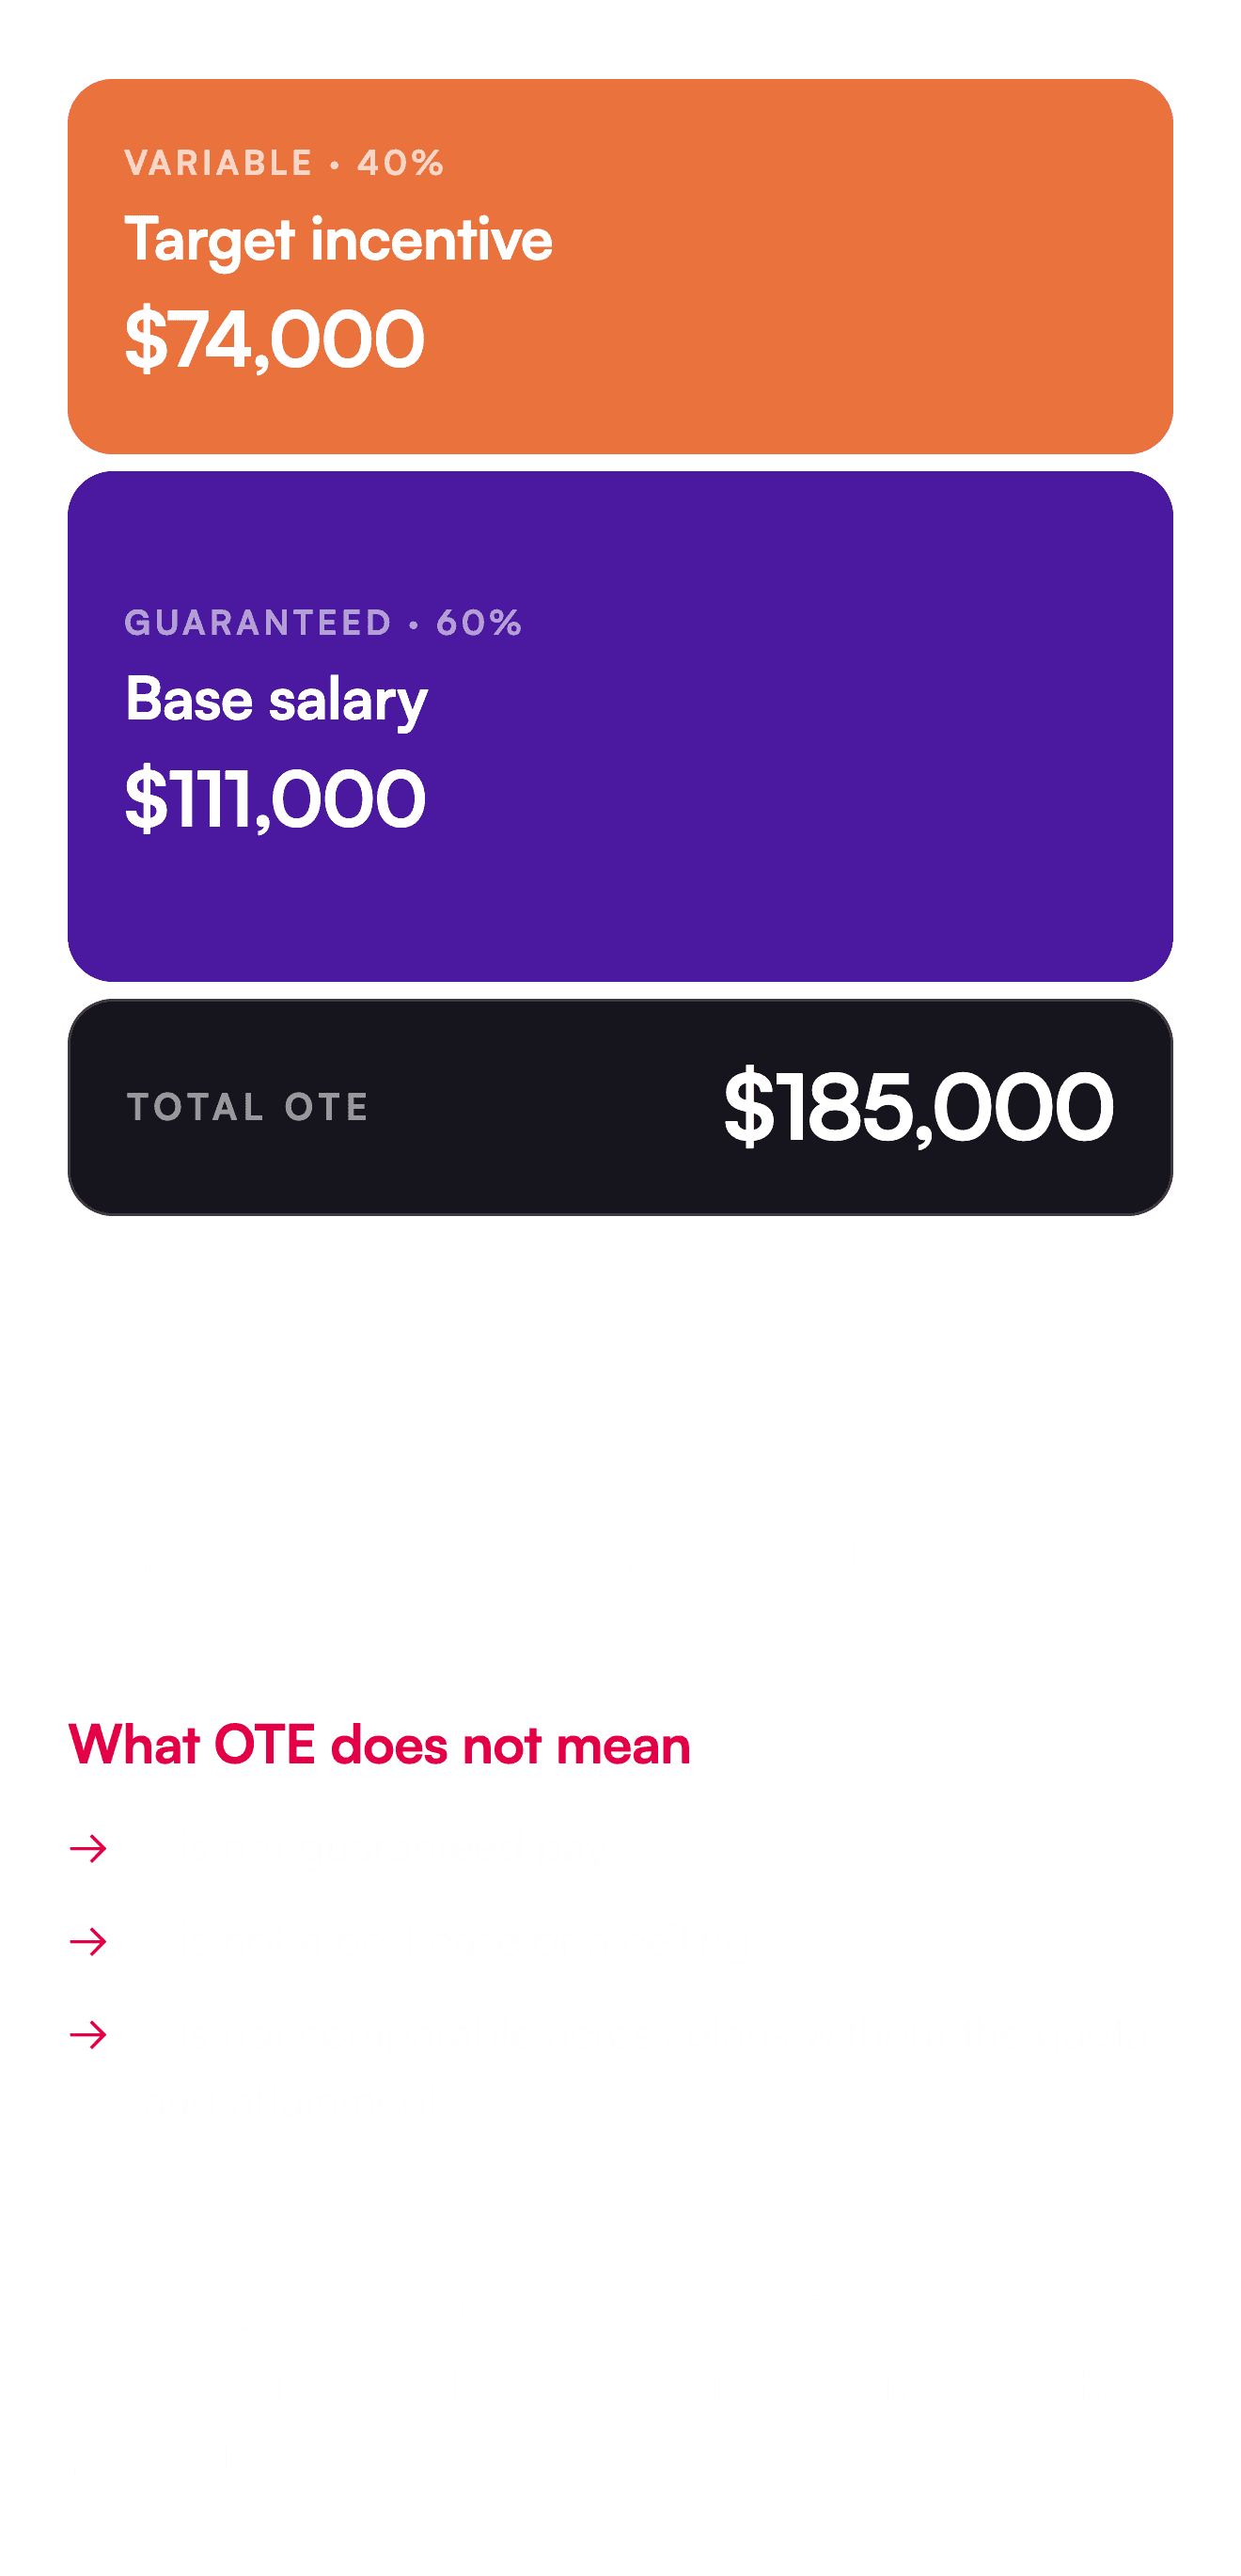
OTE is the sum of base salary and target incentive at 100 percent of quota. The pay mix determines how much of it is guaranteed. Illustrative.
The qualifier in the middle of the term carries the weight. A posting advertising an $185,000 OTE describes what a seller earns at target performance, while a seller who lands at 80 percent of quota earns less.
OTE should reflect realistic earnings for a good performer, rather than a best-case scenario. A number built on what a top performer clears in a strong year produces a plan most of the team will never reach, and the market data will not support it.
OTE also covers target performance across every compensation element in the plan, so a base commission, a strategic account bonus, and a multi-year deal incentive all sit within it at their target values. Our primer on commission-based compensation structures covers how those components fit together.
The most common error we see is an OTE set based on a single blended market number, with no role, level, or geography attached. It produces a range that doesn't fit anyone on the team precisely, and the gap shows up first in offer declines and later in regrettable attrition.
Four inputs narrow the market data before any positioning decision is made. Each needs to be settled in order, because an error early compounds through everything that follows.
The Role
The title on the org chart is not the benchmark. An Account Executive assigned to SMB accounts is often a pure hunter compensated on new logos, while an Account Executive assigned to Enterprise accounts often focuses on expansion within an existing territory. Both carry the same title, and neither benchmarks the same way.
Establish the role before matching it to data. Assess time allocation between hunting and farming, deal complexity by size and cycle length, and the role's autonomy over pricing. Our guide to applying benchmark data covers this reality check in full.
The Level
Once the role is defined, match it to a level in the benchmarking data. A company running SMB, Mid-Market, and Enterprise Account Executives has to determine which grade in the survey taxonomy each corresponds to, and that mapping follows required scope and experience rather than internal title.
Levels can be skipped. Where an Enterprise Account Executive requires 10 years of experience, and 10 years sits at the lower bound of an Advanced grade, that role maps to the Advanced grade even when the Mid-Market role sits two grades below. The gap is a deliberate talent strategy decision.

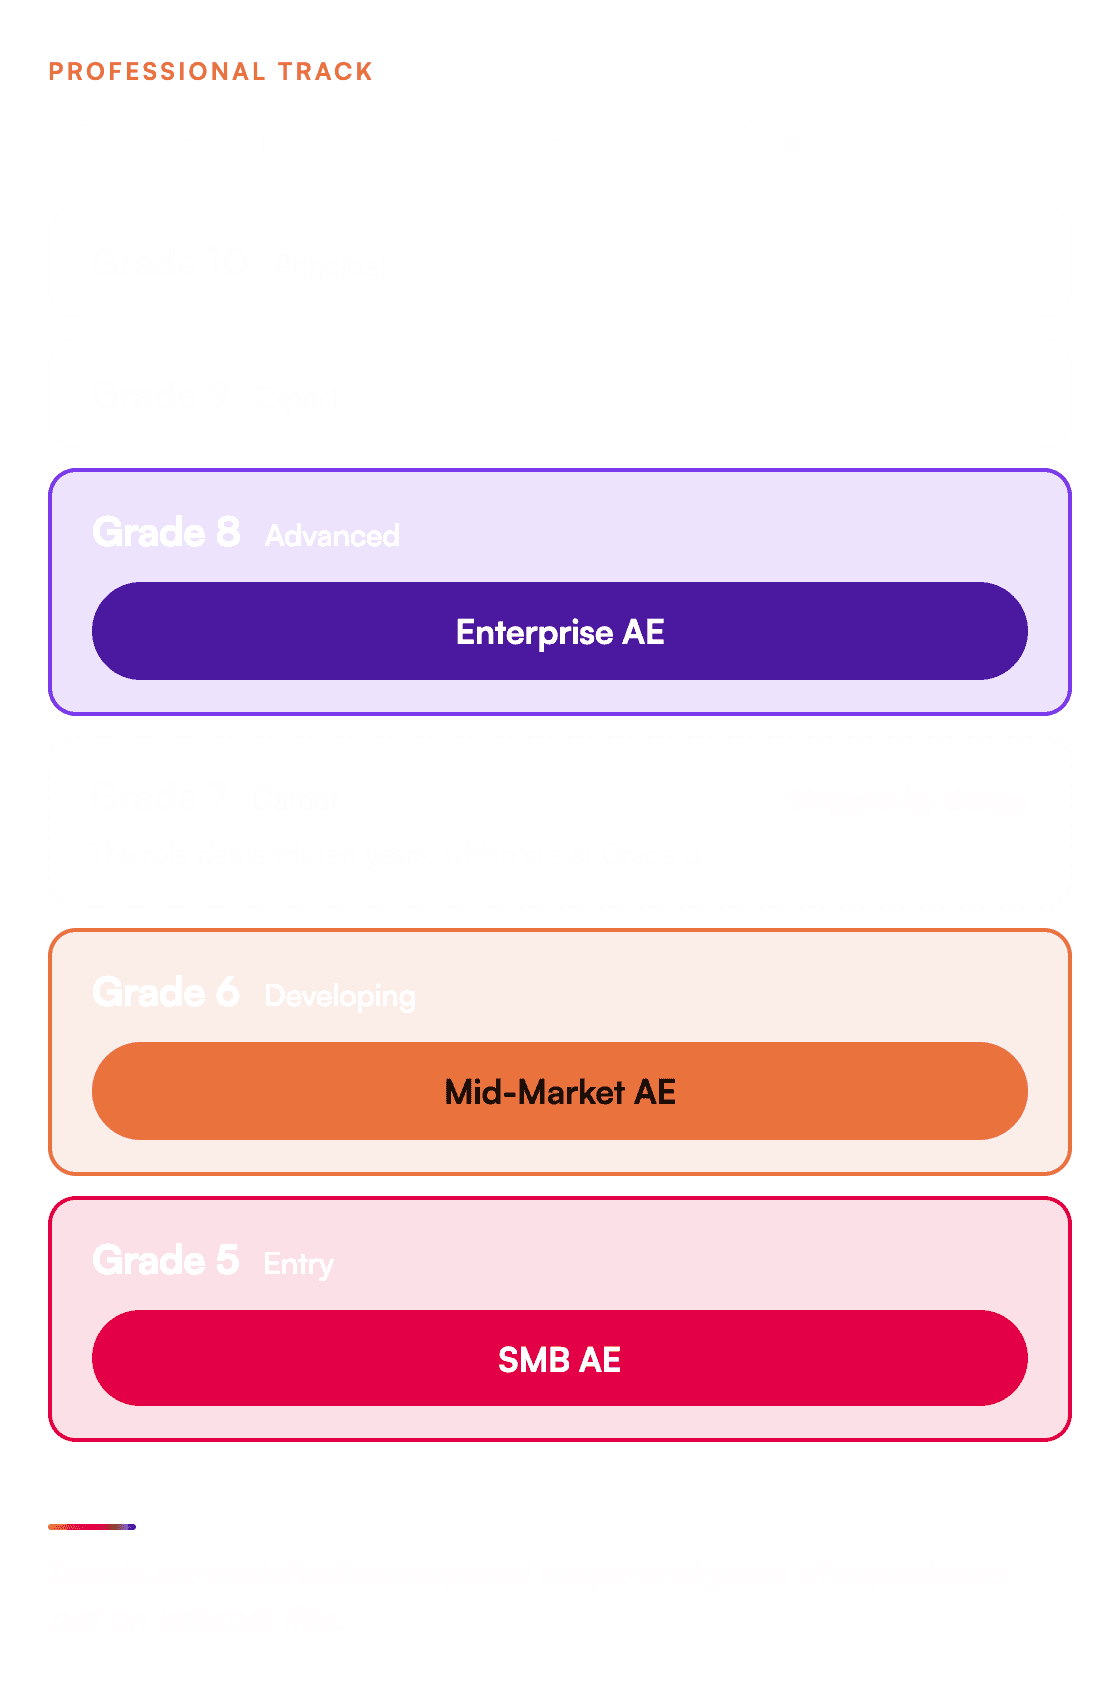
The mapping holds only where the levels beneath it are defined. Our posts on the foundation and execution of sales career architecture cover how job families and levels get built before any benchmark matching is attempted.
Geography
Pay varies by market, and the same role carries a different median across cities. An SMB Account Executive at the 50th percentile might sit near $150,000 in New York and near $155,000 in San Francisco.
Two models handle this. A one-to-one model creates a unique range for each city, which is precise and costly to maintain. A one-to-many model groups cities into bands in which the highest benchmark in a band is no more than 5 percent above the lowest, and every city in the band carries the midpoint rate.


Neither model is wrong. The choice depends on how many locations you carry and how much variance sits between them.
Market Positioning
The first three inputs produce a market picture. The fourth is a talent, finance, and business decision that needs to be explicit rather than inherited. Choose the percentile you intend to pay at against your talent strategy and budget rather than defaulting to the median.
This decision affects every downstream element, which is why it belongs early in the design process. We treat the 50th percentile as the floor rather than the target, and our view on what market competitive actually means covers this reasoning in depth.
Sales Compensation and Incentive Design
Market positioning is the decision that shapes every range you build. We help commercial leaders set it deliberately and defend it to Finance.
Once the OTE is set, the pay mix splits it. The split should reflect how much control the role has over its own results and how quickly those results become visible.
Short cycles with high seller influence support more variable pay, because the seller can move the number. Long, complex cycles that depend on a buying committee need more base because tying a large share of income to a deal that takes months to close creates instability rather than motivation.
SDRs and BDRs typically run at a 70/30 split. SMB Account Executives run 50/50 or 60/40, Enterprise Account Executives run 60/40 or 70/30, and Customer Success roles run 80/20 or 70/30.
Our post on how pay mix and OTE vary by role and segment works through the reasoning behind each.
An OTE is not finished when the number is set. It has to be tested against the quota it sits alongside, because the two together determine whether the plan is affordable.
We test the relationship as a multiple: quota divided by OTE. A $185,000 OTE against a $925,000 quota is a 5x multiple, putting the compensation cost at 20% of the revenue the role is expected to generate at full attainment. Move the quota to $740,000 and increase the number of drops to four, pushing that cost to 25 percent.
Neither number is right in the abstract. The multiple has to work against your gross margin, segment, and cycle length. What matters is that the test happens before the plan is published.
Territory design sits underneath this. Assigning a quota to a territory without the opportunity to support it makes the multiple meaningless, and our quota-setting guide covers how to build quotas the territory can carry.
The second test asks whether enough people reach the number. An OTE few sellers achieve is an optimistic target rather than a competitive one, and candidates increasingly check this before accepting an offer.
Two figures get confused here, and separating them changes the answer. The share of sellers reaching 100 percent of quota is a headcount measure. Average attainment across the team is a performance measure.
The share-to-quota ratio tells you whether the target is achievable. Average attainment tells you what the plan will cost. A team in which 55 percent of sellers clear quota can still average 90 percent attainment because shortfalls below target pull the average down without changing the headcount figure.
We treat 55 to 60 percent of sellers reaching 100 percent as a healthy standard when the company hits plan, a point our post on market competitive sales compensation develops in full.
A benchmarked OTE and a healthy attainment rate are two separate tests, and passing one does not imply the other. We have seen well-benchmarked plans where fewer than a third of sellers reached their targets, turning a market-competitive number into an uncompetitive one in practice.
The steps come together in the Chicago Mid-Market Account Executive. The role carries a 70 percent new-logo and 30 percent expansion motion, an average deal size of nearly $85,000, and a 90-day cycle.
The role reality check confirms that a hunter works a defined territory, which aligns with a Mid-Market benchmark rather than an Enterprise one. The scope and the 4 to 7 years of experience required place the role in the Developing grade. National data at the 50th percentile for that match shows $175,000.
Chicago runs at 98 percent of the national figure, bringing the market reference to $171,500. The company competes for talent against better-known employers and carries a modest equity package, so it positions at the 60th percentile and sets the OTE at $185,000. At a 60/40 mix, that splits into $111,000 of base salary and $74,000 of target incentive.
Setting One OTE, End to End
Mid-Market Account Executive, Chicago. Illustrative figures.


When CRM, ERP, and HRIS feed one connected engine, credit is right, statements reconcile, and everyone works from the same numbers. Disconnected systems break at the handoffs, no matter how clean each one is.
The range follows from the midpoint. Spread here is measured against the midpoint, so a 40 percent spread places the minimum at 80 percent of the midpoint and the maximum at 120 percent. That puts the minimum at $148,000 and the maximum at $222,000, with most external hires landing near 90 percent of the midpoint, or $166,500.
Against a $925,000 quota, the multiple is five, putting compensation at 20 percent of expected revenue at full attainment. At an 85 percent average attainment, the $74,000 target incentive pays out to about $63,000, so expected earnings are around $174,000 rather than $185,000.
The four checks applied to the worked example. Figures are illustrative and modeled on a single Mid-Market Account Executive role.
Pay Architecture and On-Target Earnings is Element 2 of Layer 4 in the Sales Compensation Growth Model, and they connect in three directions.
Upstream, it depends on career architecture. An OTE attaches to a level, and without defined levels, there is nothing to benchmark against.
Alongside it, pay mix splits the number, and performance measures, pay curves, and accelerators all take the OTE as their input. Set the OTE wrong and each of those elements inherits the error.
Downstream, OTE drives the cost model Finance carries into capacity planning and next year's headcount budget. Within the wider Growth Excellence Model, this work sits in the People pillar and connects to Commercial Operations through quota and territory design. Our benchmarking work with a global consumer electronics leader shows what that connection looks like in practice.
An OTE is the product of four inputs and two tests. Define the role by what it actually does, match it to a level based on required scope and experience, apply geography using city rates or bands within plus or minus 5 percent, and choose your market percentile deliberately at the 50th or above.
Four Inputs, Two Tests
The inputs produce the number. The tests decide whether it holds.


Then test the number twice. The quota-to-OTE multiple indicates whether the plan is affordable, and the attainment rate indicates whether it is achievable. A number passing both is one you can present to a candidate, a sales leader, and a CFO with the same explanation.
Sales Career Architecture Guide
The levels, families, and range structures that every OTE attaches to.
Sales Compensation and Incentive Design
We build the pay architecture, ranges, and governance that make an OTE defensible.
Sales Compensation Growth Model
The 25 decisions behind a sales compensation program, and where pay architecture connects to each.
The next article covers compa ratio and range penetration: how to read where a seller sits inside the range you have built, what each position signals, and the decisions that reading drives.