

Compa-ratio is a person's pay divided by the midpoint of their salary range, expressed as a number around 100. Reading it correctly is what separates a defensible merit decision from an expensive one.
A manager pulls a Position-In-Range Report for the Chicago Mid-Market Account Executive team before the annual cycle. One seller is paid $166,500 and another $205,000, with a midpoint of $185,000. This post covers what those positions tell you and what to do about each one.
This post sits on top of Element 2 of Layer 4 in the Sales Compensation Growth Model: Pay Architecture and On-Target Earnings. That element builds the range, and the compa-ratio shows where people sit within it.
Our post on how to set an OTE covers the first step in the OTE and pay architecture construction process.
Divide a person's pay by the midpoint of their range, then multiply by 100. Someone paid at the midpoint has a compa-ratio of 100, and someone paid 10 percent below the midpoint has a compa-ratio of 90.
The midpoint anchors the calculation because it represents the market rate for the role at that level. A compa-ratio of 100 means you are paying what you set out to pay, and everything above or below reads as a deviation from that intent.
Take the Mid-Market Account Executive range built at a $185,000 midpoint, running $148,000 to $222,000. Spread here is measured against the midpoint, so a 40 percent spread places the minimum at 80 percent of the midpoint and the maximum at 120 percent.
A seller paid $166,500 sits at a compa-ratio of 90. Our guide to applying benchmark data covers how that range gets built.
Compa-ratio measures position against a structure. It says nothing about performance, and for a quota-carrying role, it says nothing about earnings.
Three Mid-Market Account Executives can each sit at a compa-ratio of 100 and take home very different amounts. On a 60/40 mix, the base salary is $111,000 for all three. The seller at 70 percent of quota earns roughly $162,800, the seller at plan earns $185,000, and the seller at 140 percent with accelerators clears $229,400.
Same Compa Ratio, Different Take-Home Pay
Three Mid-Market Account Executives, all at a $185,000 OTE on a 60/40 mix. Compa ratio 100 for each.
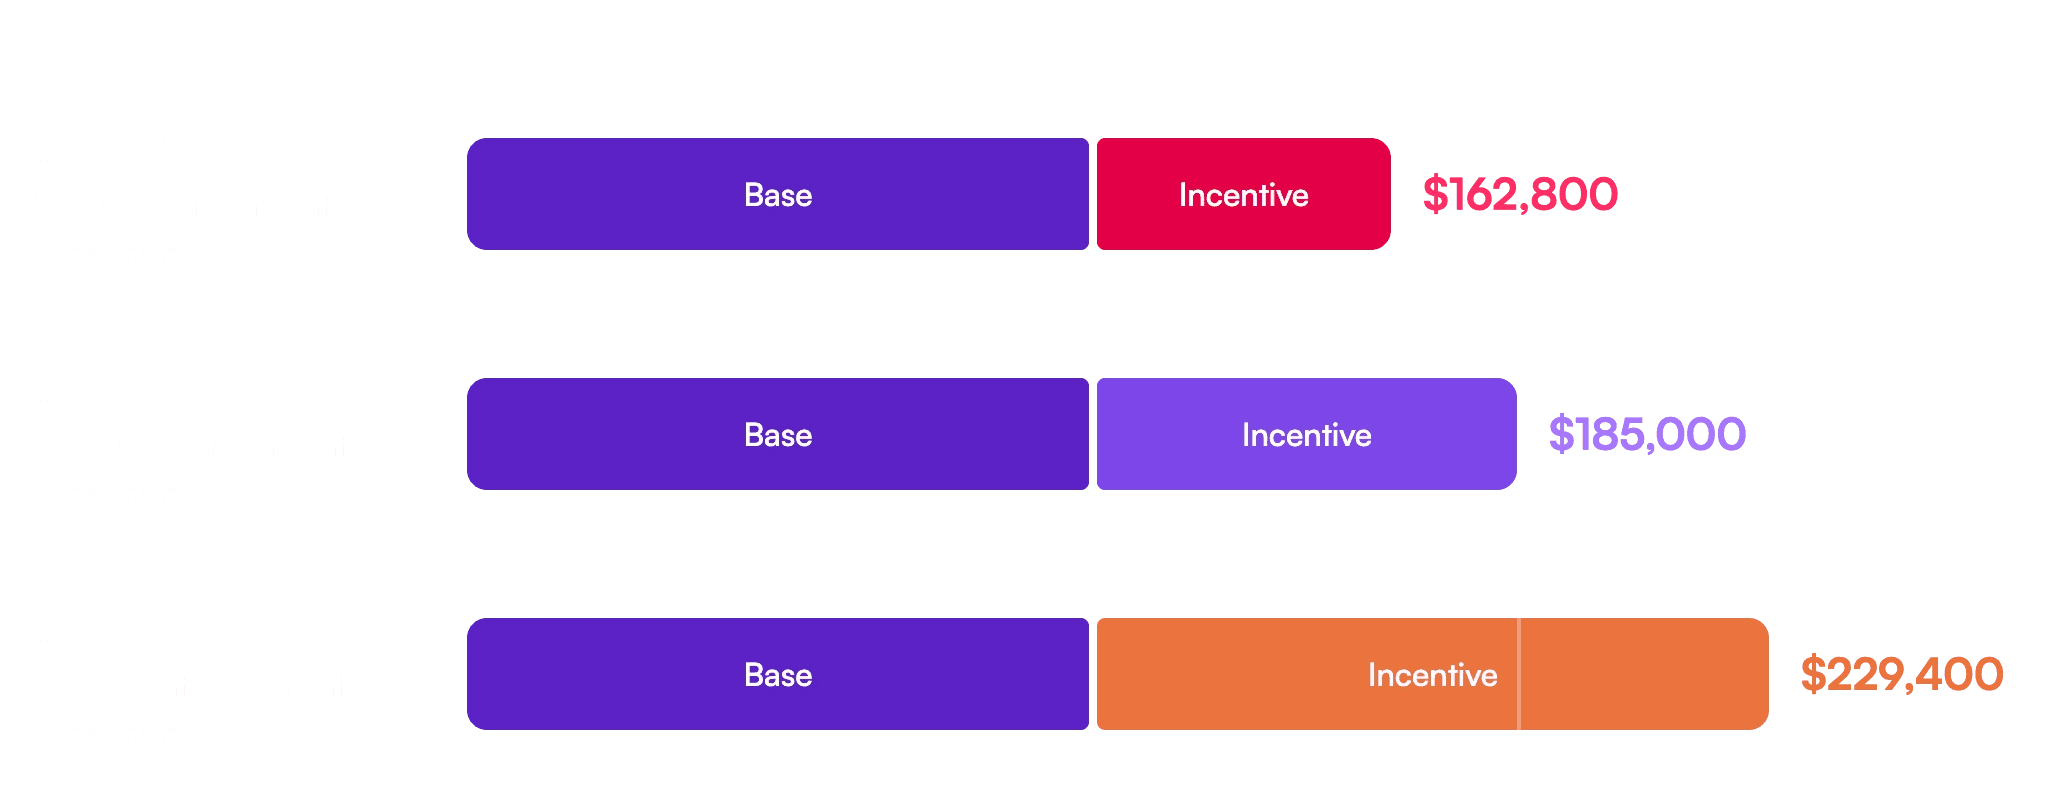

Illustrative. Accelerator applied at 1.5 times the target rate above 100 percent of quota.
A manager who calls someone a top earner is describing attainment. A manager who calls someone high in range is describing structure. Our post on paying for outcomes and coaching on activity covers why those two conversations need to stay separate.
This shows up in calibration. A manager argues for a large merit increase because the seller beat their number, even though the incentive plan already paid for it. Compa-ratio keeps the two apart: it tells you where someone sits against the structure, which is what merit is meant to answer.
Range penetration indicates where a value falls between the minimum and maximum, expressed as a proportion of the full range width. The same seller at $166,500 sits $18,500 above the $148,000 minimum, within a $74,000 range, representing 25 percent penetration.
Two Measures of the Same Position
One seller at $166,500 in a range running $148,000 to $222,000, midpoint $185,000.


The two formulas applied to the same seller. Compa-ratio compares pay to the market rate, and range penetration measures how much room remains within the range. Illustrative.
In a symmetric range the two track together, so most teams need only compa-ratio. They separate when ranges are asymmetric, which is common at senior levels when the top is extended without moving the bottom.
An Enterprise Account Executive paid $240,000 against a $240,000 midpoint in a range of $204,000 to $312,000 has a compa-ratio of 100 and a range penetration of 33 percent. The first number says market rate. The second says two-thirds of the range still sits above them, which is what a retention conversation needs.
The number earns its keep in five recurring decisions, each of which uses it differently.
The recurring decisions compa-ratio informs, and what the number changes in each.
A 4 percent merit budget does not mean 4 percent for everyone. The matrix takes a performance rating and a position in range and returns an increase. Two Account Executives, both rated as exceeding expectations, can receive different increases from the same budget: the seller at 88 earns 6 percent, and the seller at 116 earns 2 percent.
Same Rating, Two Positions, Two Philosophies
Both Account Executives rated as exceeding expectations. Midpoint $185,000, range $148,000 to $222,000.


Both are defensible. The question is whether merit should correct a gap that performance did not create.
Two Account Executives with the same rating under two allocation approaches. Illustrative, at a 4 percent focal budget.
Two people performed the same and were paid differently for it. That deserves a direct answer rather than a reference to the matrix.
The case for weighting position starts with what the range represents. It states what the role is worth at that level, and two people doing the same job should converge toward it. Hiring below midpoint is deliberate, and a seller at 88 may simply be early in that convergence. The distance between 88 and 116 often has little to do with performance, reflecting instead who negotiated harder at hire, what they earned at a previous employer, or which manager approved the offer. The question merit answers is whether that gap closes on any schedule at all.
Equal percentage increases preserve that original gap permanently and widen it in absolute dollars every year. There is also a mechanical constraint, since a 4 percent increase for the seller at 116 would push them past the range maximum and force an exception. Pay transparency regulation adds weight here, because pay differences increasingly need an explanation that holds up, a point our guide to the EU Pay Transparency Directive develops in full.
The case against is equally direct. Merit is meant to reward performance, and position-in-range differentiates based on something the seller did not control this year. A person at 116 may sit there because of sustained results the organization already recognized, so slowing their increase reads as a penalty for having been rewarded.
A stale or mis-benchmarked range also makes the correction move toward the wrong number, which is why reading benchmark data correctly matters before the matrix is applied.
A third approach keeps the two apart. Fund merit on performance alone, and handle position through a separate equity adjustment budget. The correction becomes a visible line item, defended on its own terms, rather than being quietly absorbed into a matrix cell.
We do not think there is one answer that fits every organization. The decision worth making deliberately is how much authority a position in range should hold over the performance rating, and whether a budget meant to reward performance should also correct a gap that performance did not create.
Promotion drops compa-ratio, and that is the point. An IC3 paid $185,000 at a compa-ratio of 100 who is promoted with a 15 percent increase lands at $212,750 against a $240,000 IC4 midpoint, which is a compa-ratio of 89. Pay rose 15 percent and compa-ratio fell 11 points because the new range is built for a bigger job.
The timing matters more than the arithmetic. Promote an IC3 already sitting at 115, or $212,750, and the first quartile of the IC4 range is $216,000, so the increase is close to nothing. Waiting until someone maxes out at their current level prevents you from making the promotion feel like a real promotion.
This is where compa-ratio connects to talent strategy rather than payroll. The population between the third quartile and the maximum is your promotion-ready group, and the competency model within your sales career architecture determines whether they are ready for the next level or simply well paid for the current one. Our post on building tomorrow's performers covers the leadership side of that judgment.
Sales Compensation and Incentive Design
A compa-ratio is only as good as the range it's based on. We build the levels, ranges, and reporting that make the position defensible to Finance and to your sellers.
Most compensation systems calculate compa-ratio on base salary because most roles have only a base salary. Sales roles have two components, and the choice changes the answer.
We calculate at OTE for quota-carrying roles because that is the level at which the range was built. Two Enterprise Account Executives both carry a $240,000 OTE: one on a 70/30 mix with a $168,000 base, and the other on a 60/40 mix with a $144,000 base.
Measured at OTE, both sit at 100. Measured on base salary alone, they look $24,000 apart, in a comparison that reflects a risk decision rather than a pay position. Our post on how pay mix and OTE vary by role and segment covers why those splits differ.
The practical obstacle is that the base salary is in the HRIS, and the target incentive is in the incentive compensation platform. The HRIS calculates compa-ratio natively on the only number it holds, so producing an OTE-based figure means reconciling two systems.
That reconciliation is worth building once and running on a schedule. Keeping the reporting simple enough to sustain is the same discipline our post on simple and scalable comp plans applies to plan design.
A single compa-ratio describes one person. The distribution across a team tells you whether the structure is working.


The expected distribution across a range, the population share in each zone, and the management action each zone calls for. Illustrative.
Departures from that shape are diagnostic. A population clustered below the first quartile suggests the range moved and people did not. A population clustered above the third quartile suggests the level has become a destination rather than a step, and promotions are overdue.
Top performers bunched at the maximum is the clearest signal that a range needs revisiting and a leading indicator of regrettable attrition. Our work on talent retention and role architecture covers how role design absorbs that pressure.
Compa-ratio also drifts on its own. Ranges move 3 to 5 percent a year on market data, so a person whose pay is unchanged sees their compa-ratio fall by roughly the same amount. Holding position throughout the annual cycle means funding the structure's movement separately from the performance reward.
Sustained drift causes salary compression, narrowing the gap between tenured performers and new hires until it disappears.
Compa-ratio is not one of the 25 elements in the Sales Compensation Growth Model. It is the measurement layer sitting on top of Element 2, and it only exists once that element has produced a range. Upstream, it depends on career architecture, because a compa-ratio requires a level, and a level requires a defined job family and progression path, which our post on career architecture execution covers in detail.
Downstream, it feeds merit allocation, quarterly governance reporting, and the Finance model that prices the cost of bringing a level to market. It also tests the market competitive claim your plan makes, a subject our post on why benchmarked OTE is only half the story takes further.
Within the wider Growth Excellence Model, this work sits in the People pillar and connects to Commercial Operations via the systems that hold the underlying pay data. The full benchmarking cycle that produces those ranges is covered separately.
Compa-ratio answers one question well: are we paying this person the market rate we set for their level? Range penetration answers the companion question about remaining room, and the two separate whenever a range is asymmetric.
For sellers, calculate it at OTE rather than base so the measure matches the level at which the range was built. Then use it where it changes a decision: sizing a merit increase, timing a promotion, constructing an offer, and pricing what a level would cost to bring to market.
Sales Career Architecture Guide
The levels, ranges, and quartile design that every compa-ratio is measured against.
Sales Compensation and Incentive Design
We build the ranges, reporting, and governance that keep pay positions defensible.
Sales Compensation Growth Model
The 25 decisions behind a sales compensation program, and where pay architecture connects to each.
The next article covers compensation philosophy: how to choose the market percentile you pay at, what each position commits you to, and how that decision shapes every range you build.