September 14th, 2026
What Is a Sales Incentive Program? A Complete Guide to Compensation Plan Design
Written by

Carmen Olmetti

A sales incentive program rewards sales professionals for performance against an assigned quota. It pairs a fixed base salary with a variable component that moves with results. That variable component is what separates quota-carrying roles from the rest of the organization, where pay is typically a salary plus a discretionary company bonus.
The distinction shapes everything downstream. A company bonus rewards participation in a shared outcome and is often discretionary. A sales incentive plan pays a specific seller for a specific, measurable result they influenced directly.
Most organizations arrive at their current plan through accumulation. A rate gets adjusted one year, a measure gets added the next, an exception becomes a precedent, and five years later nobody can explain why the plan looks the way it does. A designed program starts from a different question: what does the business need sellers to do, and what does the plan have to pay to make that happen?
This post covers vocabulary, arithmetic, and sequence. It is written for anyone building a plan for the first time, inheriting one that needs repair, or sitting in the room while somebody else does.
Compensation conversations break down when participants use the same words in different ways. These fourteen terms cover most of what a plan document contains.
Target Variable
The incentive amount is earned at 100 percent of the quota.
On-Target Earnings (OTE)
Base salary plus target variable. Total expected cash at quota.
Pay Mix
The ratio of base to variable within OTE is expressed as 60/40, 70/30, and so on.
Quota
The performance target assigned to a role for a defined period.
Threshold
The attainment level at which incentive payment begins.
Target
100 percent of the quota, where the target variable is earned in full.
Excellence
The attainment level reached by the top decile of the population.
Leverage
Total variable pay earned at excellence, expressed as a multiple of target variable.
Accelerator Rate
The multiple applied to the commission rate above 100 percent attainment.
Performance Period
The window over which attainment is measured.
Payout Period
The frequency at which the earned incentive is paid.
Crediting
The rules determine which seller receives credit for a booking, and when.
Draw
An advance against future incentive earnings, either recoverable or non-recoverable.
Two of these carry more design weight than the rest. Pay mix determines how much of a seller's income depends on results. Leverage determines what excellent performance pays. Nearly every other decision in a plan sits downstream of those two numbers.
Eligibility is the first and one of the most consequential plan decisions, because it defines the population that the cost of sales must cover. Three tests apply.
The role has direct customer interaction and influence over purchasing decisions.
Individual effort measurably changes sales results.
The contribution can be attributed to the individual based on the available data.
Account Executives, Business Development Representatives, and quota-carrying Sales Managers pass all three. Sales operations, enablement, and administrative roles generally don't pass any of them and should instead be on a bonus structure.
The difficult cases sit in between. Solution engineers, customer success managers, and overlay specialists influence outcomes without owning them. These roles usually work best with a plan that has a more conservative mix and a measure tied to the team outcome they support, as covered in depth in Role Eligibility and Org Structure and Job Role Design.
Three RevEng engagements show what changes when the arithmetic is done properly.
Cost-Neutral Upside For Top Performers
A local community platform experiencing rapid growth needed to evolve its roles and compensation plans. RevEng benchmarked against Radford career architecture, ran 10 core pay-for-performance analytics, and built differentiated quota bands with accelerator rates derived to match each band.
The resulting accelerator program was modeled and proven to be cost-neutral while creating materially more upside at the top. Quota performance improved by 10 percentage points, and the structure remained in place two years later. Read the Nextdoor case study.
Crediting Rules That Redirect Channel Behavior
A global confectionery company set out to make direct and partner plans market competitive and to grow partner revenue. The review identified three constraints on scaling the partner program, and the diagnosis pointed to crediting: the timing of partner payments did not reinforce the behavior the business wanted.
Restructured plans and revised crediting rules produced nearly 30 percent partner revenue growth within one year, and the program sustained year-over-year growth for close to four years. Read the Haribo case study.
Role Design That Unlocks the Revenue Goal
A global healthcare and clinical diagnostics company set a 30 percent new-revenue goal from land-and-expand bookings, alongside competing internal views on role count and the compensation model. Field surveys, high-performer personas, and Radford benchmarking produced a new career architecture, a regional pay mix strategy, and a cost-neutral accelerator program.
Roles were separated so each focused on either new revenue or growth from existing accounts, and the company reached its new revenue goals. Read the Global Health Company case study.
Additional compensation engagements across media, technology, industrial, and consumer sectors follow similar patterns. The full set is in the case study library.
Start with an enterprise Account Executive at $180,000 OTE on a 60/40 pay mix, carrying a $2,000,000 quota.

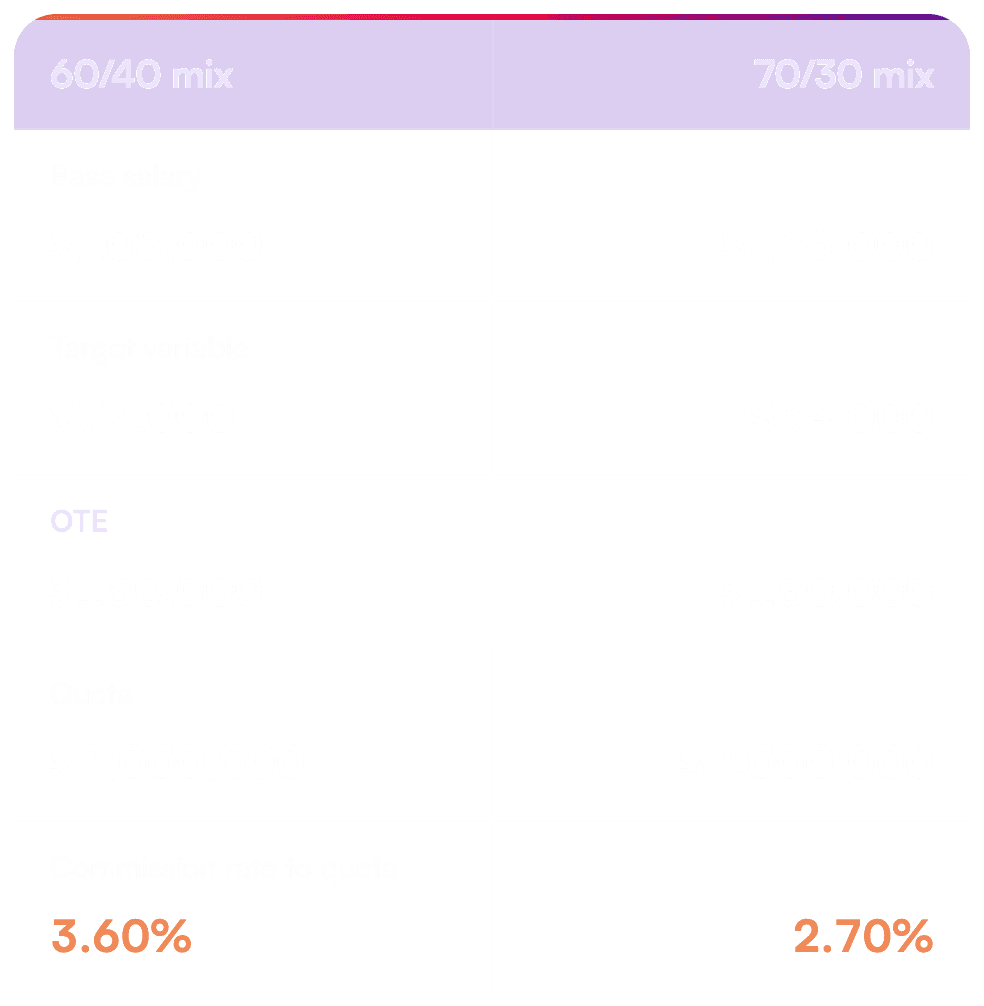
Total cash at quota is identical. The behavior the two plans produce is not.
The 60/40 seller carries $72,000 of income contingent on results and earns 0.9 percentage points more on every dollar sold. The 70/30 seller trades that upside for $18,000 more in guaranteed cash flow.
Mix follows the level of persuasion the role holds over the sale. Roles that create demand and close it carry more variables. Roles that service demand already in motion carry less.
Survey data from major compensation providers places the enterprise Account Executive mix in the 50/50 to 60/40 range across most technology segments, with account management and renewal roles clustering closer to 70/30.
One caution. Merit increases applied to base salary rather than to OTE quietly change the ratio. A 60/40 plan that receives three consecutive base-only merit cycles drifts toward 63/37 without anyone deciding to make the plan more conservative.
Pay mix is best held as a global structure while OTE flexes locally, and merit applied to OTE preserves that structure.
Continue with the 60/40 Account Executive: $72,000 target variable, $2,000,000 quota, 3.60 percent commission rate.
The threshold sits at 60 percent of the quota. Below that point, no incentive is earned. Once the threshold is crossed, this plan pays from the first dollar.


Threshold placement is both a cost and a motivation decision. A threshold at 60 percent means sellers who finish at 55 percent earn no variable pay, concentrating the budget on performers. A threshold of 40 percent spreads payments across a wider population and raises the total program cost for any given attainment distribution.
Healthy design targets 55 to 65 percent of the population at or above the quota. Attainment materially above that range suggests quotas set too low to distinguish performance. Attainment materially below it suggests a quota methodology disconnected from territory opportunity, which is a territory design problem rather than a plan mechanics problem.
Accelerators are calculated, not negotiated. The rate is determined by two inputs: what the business intends to pay its top decile and what the top decile actually earns.
Accelerator rate = (Leverage minus 100%) divided by (Excellence attainment minus 100%)
The leverage for this role is 2.5x, or 250% of the target variable. Excellence for the relevant quota band sits at 145 percent attainment.
(250% minus 100%) divided by (145% minus 100%) = 150 divided by 45 = 3.33x
Applied to the base commission rate: 3.60 percent multiplied by 3.33 gives 12.0 percent on every dollar above quota.
Check the result at Excellence.


The math closes. A seller reaching the top decile earns exactly the leverage the business set out to pay, and the cost of that outcome was known before the plan was published.
Leverage correlates strongly with pay mix. Account Executives typically run 2.5x to 3.5x. Relationship and account management roles typically run 1.5x to 2.5x.
Excellence comes from internal attainment distribution. It describes what your population actually achieved, which is something benchmark data cannot provide.
Excellence also moves with quota size. Larger territories compress the attainment range, so a seller carrying $50,000,000 who reaches 130 percent has performed comparably to a seller carrying $15,000,000 who reaches 160 percent. Accelerator rates rise across quota bands to keep earning opportunities equivalent for equivalent performance, which is why plans covering a wide range of territory sizes need banded accelerators rather than a single rate.
The mechanics above sit at the end of a design process rather than the start. The Sales Compensation Growth Model organizes the work into four layers, and the order matters because each layer constrains the one beneath it.
Tier 1: The Five Guiding Principles
Tier 2: Corporate-Level Elements
Tier 3: Operational-Level Elements
The dependencies run in one direction. Pay mix cannot be finalized without a talent strategy. Crediting rules cannot be written without a defined sales process. Accelerator rates cannot be derived without attainment data from a territory design that produces comparable opportunity across the population.
For the full model, including how the layers interact and where programs most often break, read The Sales Compensation Growth Model: The 25 Decisions Behind Every High-Performing Sales Comp Plan. The Sales Compensation Guide covers the same ground in downloadable form, and the Sales Compensation Assessment evaluates an existing program across all four layers.
Carrying More Than Three Measures
Focus degrades quickly past three measures, and any measure weighted below 20 percent stops changing behavior. Most roles work best with one measure tied to one sales motion. See Plan Measures.
Setting Accelerators Through Discussion
A rate arrived at by negotiation produces a payout curve nobody modeled and a cost nobody forecast. Derive the rate from leverage and excellence, then model the cost across the full attainment distribution before publishing. See Accelerator Rates.
Applying Merit to Base Rather Than OTE
Pay mix drifts, and the plan becomes more conservative than the design intended. The change happens gradually enough that it rarely gets noticed until a benchmarking cycle surfaces it. See Pay Mix.
Leaving Crediting to Convention
Undocumented crediting is the single largest source of compensation disputes. Splits, overlay treatment, and the timing of credit recognition belong in the plan document, written down before the first deal tests them. See Crediting Rules.
Running Special Incentives That Compete With the Core Plan
Special performance incentive funds, or SPIFs, work when they redirect attention toward a specific product or a specific period. Total special incentive spend above 10 to 15 percent of variable compensation starts pulling attention away from the plan that funds the business. See Special Incentives and SPIFs.
A plan that sellers cannot calculate is a plan they cannot respond to. The test is simple: hand a seller their plan document and a hypothetical deal, then ask them to calculate what they would earn. Comprehension without a follow-up session is the standard we should design toward.
Rollout carries four requirements.
Plan documents written in plain language with the calculation tables shown, including at least one worked example at threshold, one at target, and one at excellence.
Manager training covering how to coach against the new measures, since first-line managers field most plan questions.
Systems are configured and tested before the first payout cycle rather than during it.
A documented exception process ensures that the first unusual situation results in a decision rather than a precedent. See Administration and Governance.
Plans also need a review cadence. Attainment distribution, dispute volume, and cost of sales against plan tell you within two quarters whether the design is working as modeled. Programs that go a full year without measurement tend to accumulate the same drift that produced the plan being replaced.
Each element of the Sales Compensation Growth Model has a dedicated post covering the decisions, trade-offs, and numbers.
Related Resources
Sales Compensation and Incentive Design
Sales Compensation Growth Model framework
The 25 Elements of Sales Compensation Design course
Sales Career Architecture Guide
Quota Setting: A Comprehensive Guide
5 Guiding Principles for Sales Compensation Design